Mount Semeru, the tallest and most active volcano on the Indonesian island of Java, has routinely spit up small, mostly harmless plumes of ash and gas for years. The circumstances changed on Dec. 4, 2021.
Following a partial collapse of the summit lava dome early in December, sensors began to detect elevated seismic activity, according to the Volcanological Survey of Indonesia (PVMBG). After more of Semeru’s lava dome gave way, billowing fronts of superheated ash, tephra, soil and other debris raced down several channels on the mountain’s southeastern flank.
Pyroclastic flows are among the most dangerous hazards posed by volcanoes. Sometimes accelerating to speeds of hundreds of kilometers per hour, these masses of volcanic material and landscape debris can be impossible to outrun. They destroy most living things in their path. Though explosive eruptions at the summit were likely small, the pyroclastic flows at Mount Semeru on December 4 were still hot enough that they likely helped propel a billowing “Phoenix cloud” that rose as high as 15 kilometers (9 miles) into the air.
Since heavy rains preceded and accompanied the eruption, the pyroclastic flows mixed with large amounts of rainwater and morphed into muddy lahars that rushed down the mountain into populated areas. Lahars are mixtures of water and volcanic debris that behave like rivers of concrete, flattening or burying much of what they encounter.
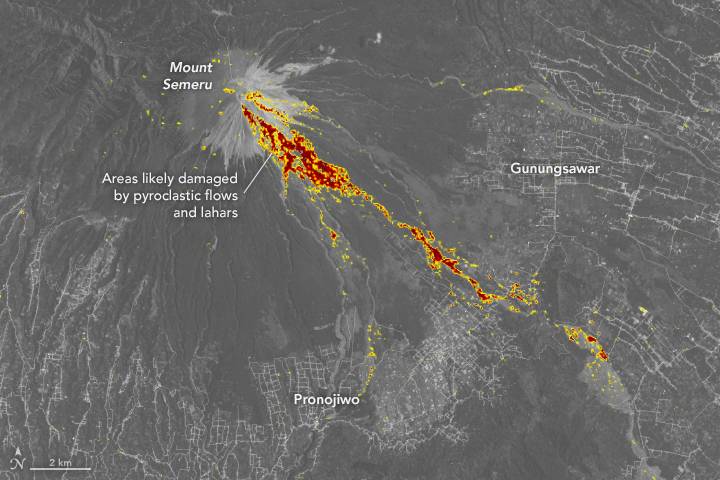
The accompanying damage proxy map shows areas on the surface that were likely damaged by pyroclastic flows and lahars in December 2021. Dark red pixels represent the most severe damage, while orange and yellow areas are moderately or partially damaged. Each colored pixel represents an area of 30 meters by 30 meters (about the size of a baseball infield). Researchers from the The Earth Observatory of Singapore – Remote Sensing Lab (EOS-RS) made the maps by comparing a post-eruption image from Dec. 7, 2021, with a set of pre-eruption images from Aug. 9, 2021, through Nov. 21, 2021.
The slurry of debris that swept down Semeru proved catastrophic to villagers living around the mountain’s base in the Lumajang Regency, particularly Curah Kobokan. According to The Jakarta Post, at least 39 people have died. Large numbers of homes were destroyed or damaged, and many animals are among the eruption’s victims.
Image Credit: NASA Earth Observatory image by Lauren Dauphin, using modified Copernicus Sentinel data (2021) processed by ESA and analyzed by Earth Observatory of Singapore (EOS) in collaboration with NASA-JPL and Caltech, Landsat data from the U.S. Geological Survey, and data from OpenStreetMap.
