As the 2020 Olympic Games opened in late July 2021, Tokyo was in the midst of a humid heat wave that pushed temperatures above 34°C (93°F) several days in a row. For meteorologists and climatologists, the arrival of sweltering temperatures in Tokyo in August comes as no surprise.
Tokyo has always had hot and humid temperatures, but after decades of global warming, increases in the frequency of heat waves, and extensive urbanization, summers in Tokyo are as uncomfortable as ever—and sometimes dangerous—for the city of 14 million.
The challenges are not unique to Tokyo. The other two finalist cities for these Olympic games—Madrid and Istanbul—were also sweating through heat waves during the last week of July 2021.
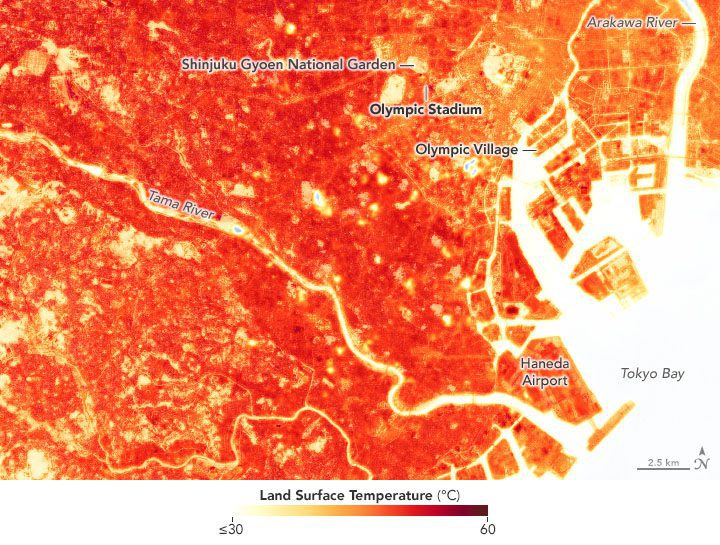
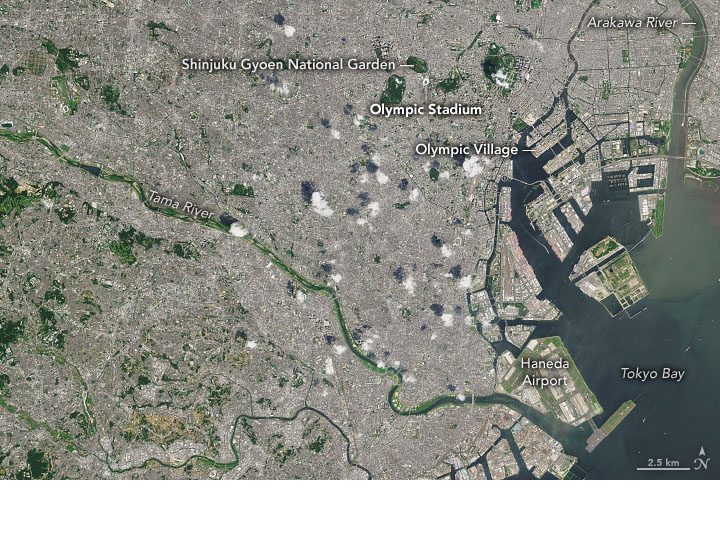
The maps above and below show the heat island effect around Tokyo on August 17, 2019, a hot day comparable to those experienced this week. The measurements are derived from observations made by the Thermal Infrared Sensor (TIRS) and Operational Land Imager (OLI) on Landsat 8. The coolest areas are white to yellow; warmer areas are orange to red. (Note: The 2019 data is being presented because more recent summertime images of Tokyo were not available from Landsat due to cloud cover. Despite the years, the relative differences between warmer and cooler areas should be roughly the same.)
The maps depict land surface temperatures (LSTs), not air temperatures. LSTs reflect how hot the surface of the Earth would feel to the touch and can sometimes be significantly hotter or cooler than air temperatures.
Image Credit: NASA Earth Observatory images by Joshua Stevens, using Landsat data from the U.S. Geological Survey.
