Early in the COVID-19 pandemic, it became clear from satellite observations and human experience that the world’s air grew cleaner. But new research shows that not all pollutants were taken out of circulation during societal lockdowns. In particular, the concentration of tiny airborne pollution particles known as PM2.5 did not change that much because natural variability in weather patterns dominated and mostly obscured the reduction from human activity.
By combining NASA spacecraft data with ground-based monitoring and an innovative computer modeling system, the scientists mapped PM2.5 levels across China, Europe and North America during the early months of the pandemic. They found seasonal differences in PM 2.5 between recent years were driven primarily by the natural variability of the meteorology, not by pandemic lockdowns. Some of the meteorological effects included changes in the sources and intensity of seasonal dust storms, the way pollutants reacted to sunlight in the atmosphere, the mixing and transfer of heat via weather fronts, and the removal of pollutants from the atmosphere by falling rain and snow.
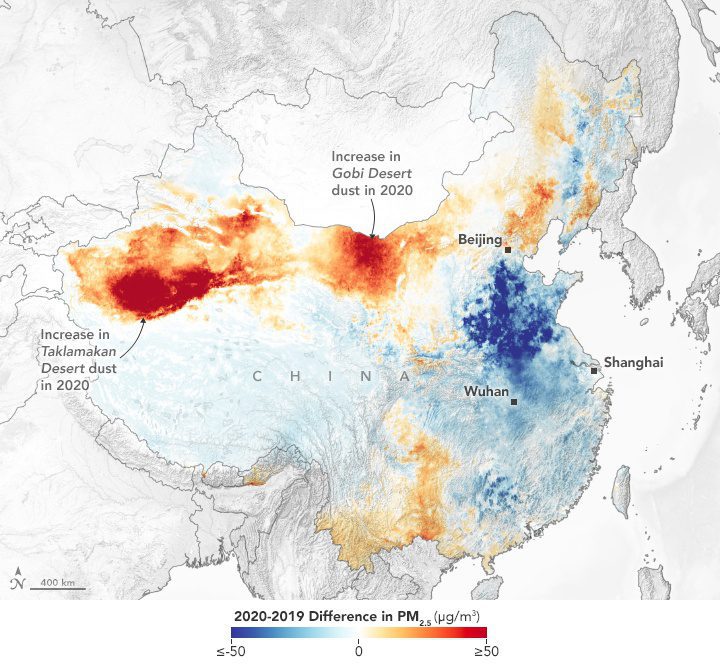
One example is shown on the accompanying map, which compares PM2.5 levels across China in February 2020 vs. February 2019. Note that although pollution levels dropped significantly in some of the most industrialized parts of China, they were actually higher near China’s desert regions. The pollution mapping effort included data from NASA’s Terra and Aqua satellites as well as meteorological modeling from the NASA Global Modeling and Assimilation Office. The study was published in June 2021 in the journal Science Advances.
