Asian Surveying & Mapping
Breaking News
Safran, SatSure partner to develop geospatial intelligence solutions for India
French aerospace giant Safran Electronics & Defense and Indian...
Singapore unveils road map to help develop international business standards and conformance
Singapore has unveiled plans to help develop international standards...
Adelaide University to run space and defence venture launchpad ahead of Australian Space Forum
Adelaide University’s Innovation & Collaboration Centre (ICC) will deliver...
Japan’s H3 rocket returns to space with successful launch after December setback
Japan’s flagship H3 rocket has returned to flight six...
KONGSBERG accelerates seabed mapping developments with Ocean Exploration Trust expedition aboard Exploration Vessel Nautilus
KONGSBERG and the Ocean Exploration Trust (OET) are set...
Russian satellites linked to mysterious GPS disruptions across several countries
Since 2019, GPS signals across Europe, Greenland and Canada...
Isro’s Bahubali LVM3 that launched Chandrayaan-3 to be handed to private sector
IN-SPACe has invited Indian companies to take over the...
India to host 13th UN Global Geospatial Information Management Asia-Pacific Conference
India is hosting the 13th United Nations Global Geospatial...
Unseenlabs’ BRO-22 to Become the First Foreign Private Satellite Launched Aboard Japan’s H3 Launch Vehicle
Scheduled for June 10, between 09:53 and 11:52 a.m....
PLD Space increases investment in its Launch Complex at the Guiana Space Centre (CSG) to €35M, strengthening Europe’s sovereign space infrastructure
The investment is expected to generate approximately €21 million...

August 17th, 2020
NASA Maps Beirut Blast Damage

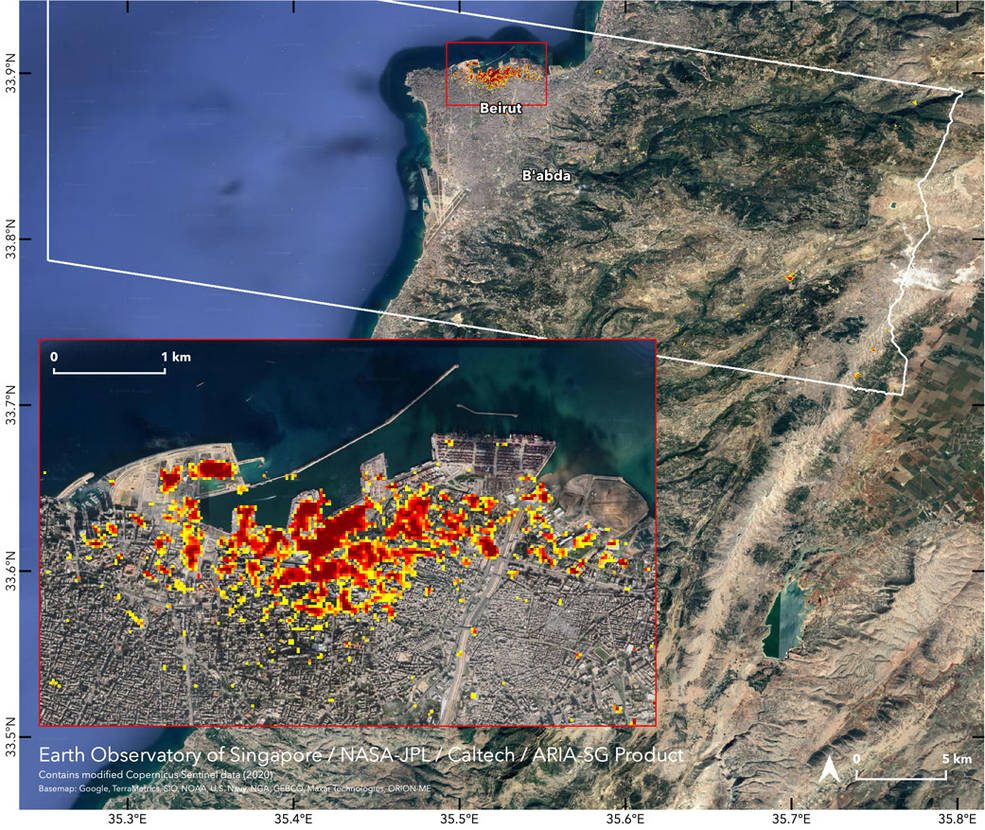
NASA’s Advanced Rapid Imaging and Analysis (ARIA) team, in collaboration with the Earth Observatory of Singapore, used satellite-derived synthetic aperture radar data to map the likely extent of damage from a massive Aug. 4, 2020, explosion in Beirut. Synthetic aperture radar data from space shows ground surface changes from before and after a major event like an earthquake. In this case, it is being used to show the devastating result of an explosion.

On the map, dark red pixels—like those present at and around the Port of Beirut—represent the most severe damage. Areas in orange are moderately damaged, and areas in yellow are likely to have sustained somewhat less damage. Each colored pixel represents an area of 30 meters (33 yards).

Maps like this can help identify badly damaged areas where people may need assistance. The explosion occurred near the city’s port. It claimed more than 150 lives and is estimated to have caused billions of dollars’ worth of damage.

Image Credit: The map contains modified Copernicus Sentinel data processed by ESA (European Space Agency) and analyzed by ARIA team scientists at NASA JPL, Caltech, and Earth Observatory of Singapore.