Asian Surveying & Mapping
Breaking News
China launches new set of classified Yaogan-43 satellites
HELSINKI — China launched a second group of classified...
China-Africa space cooperation benefits people across continent
The Egyptian satellite MISRSAT-2, a high-resolution optical remote-sensing satellite,...
Abu Dhabi astronomers discover new asteroid
ABU DHABI: The International Astronomical Centre in Abu Dhabi...
UAE’s First Private Space Infrastructure Company Launched by Marlan Space and Loft Orbital
Abu Dhabi-based Marlan Space, a new space company affiliated...
Japan’s space agency ends Moon probe operation
Japan's space agency said on Monday it had ended...
Chinese researchers assess U.S. space situational awareness, call for boost in China’s capabilities
HELSINKI — Chinese researchers are calling for improved space...
Japan’s Astroscale wins contract for space junk harvesting robotic arm
Japanese space debris cleaning outfit Astroscale revealed on Monday...
SpaceX rocket carries 2 Taiwan-developed satellites into space
Taipei, Aug. 17 (CNA) A Falcon 9 rocket launched...
Bayanat, Yahsat launch UAE’s first SAR satellite
California , August 17 (ANI/WAM): Bayanat AI PLC (ADX:...
Long March 4B launches experimental Yaogan-43 satellite group
HELSINKI — China successfully launched the first of a...

India has the highest net cropland area while South Asia and Europe are considered agricultural capitals of the world


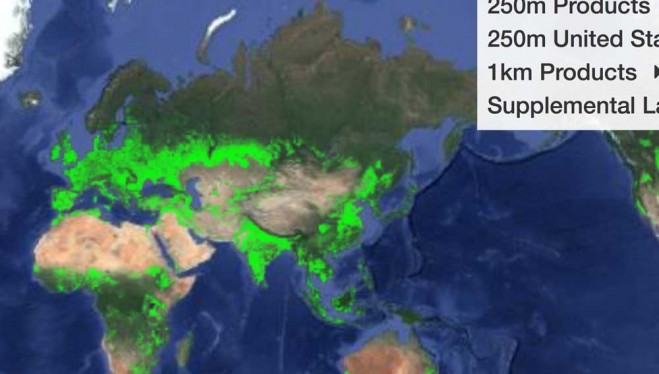
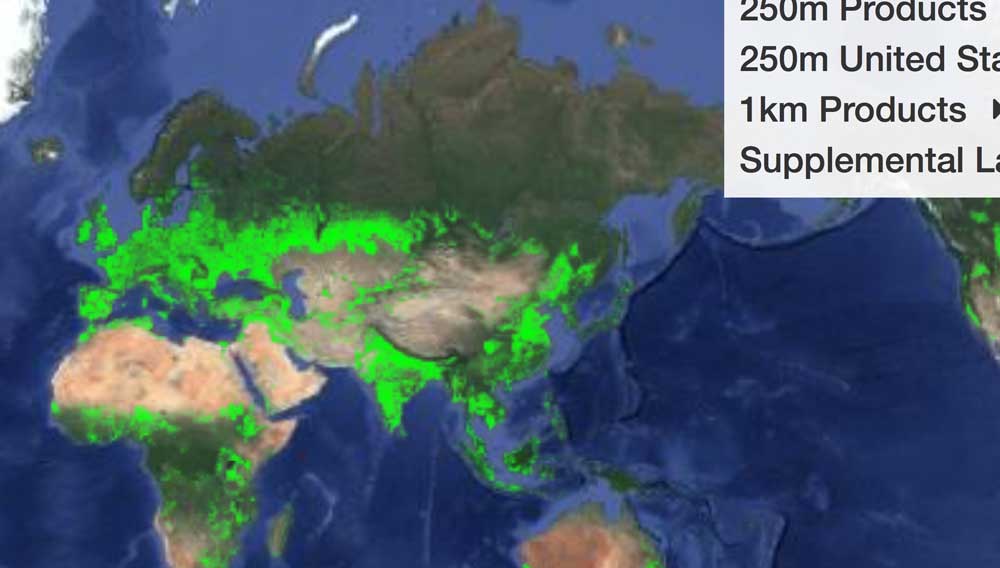
A new map was released detailing croplands worldwide in the highest resolution yet, helping to ensure global food and water security in a sustainable way.

The map establishes that there are 1.87 billion hectares of croplands in the world, which is 15 to 20 percent—or 250 to 350 million hectares (Mha)—higher than former assessments. The change is due to more detailed understanding of large areas that were never mapped before or were inaccurately mapped as non-croplands.

Earlier studies showed either China or the United States as having the highest net cropland area, but this study shows that India ranks first, with 179.8 Mha (9.6 percent of the global net cropland area). Second is the United States with 167.8 Mha (8.9 percent), China with 165.2 Mha (8.8 percent) and Russia with 155.8 Mha (8.3 percent). Statistics of every country in the world can be viewed in an interactive map.

The study was led by USGS and is part of the Global Food Security-Support Analysis Data @ 30-m (GFSAD30) Project. The map is built primarily from Landsat satellite imagery with 30-meter resolution, which is the highest spatial resolution of any global agricultural dataset.