Protecting against flooding on islands requires reliable measurements of how much the ground is sinking and where, noted Jeanne Sauber, a geophysicist at NASA’s Goddard Space Flight Center in Greenbelt, Md. “You need to know in detail where the land is going down the fastest,” she said. Sauber and several NASA colleagues are combining remote-sensing tools to figure that out.
Historically, subsidence measurements on small tropical islands have been difficult to make for two reasons. Islands often have few resources for acquiring detailed measurements at the land surface, and dense midday clouds and vegetation can make good satellite data difficult to get.
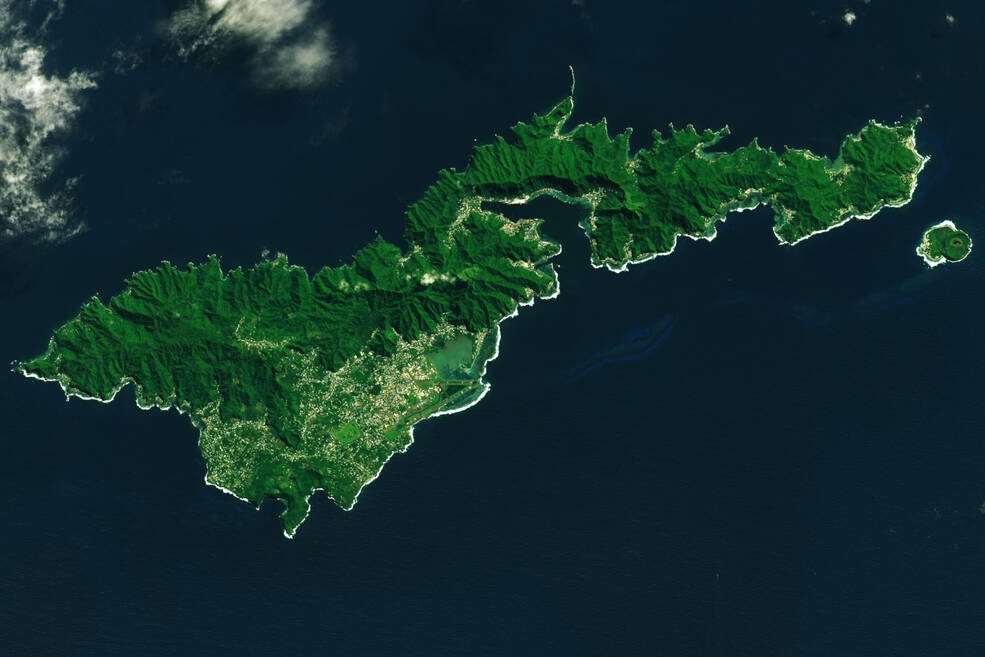
Using the island of Tutuila in American Samoa as an example, a team of NASA scientists published a study in 2022 on how to better map ground changes on earthquake-prone islands. They found that using a combination of satellite and ground-based observations could result in a more-nuanced and comprehensive map.
In the past, scientists had used data from two points of measurement on Tutuila: a GPS station and the island’s one tide gauge. They typically coupled those points with satellite altimetry, which allows scientists to broadly monitor the surface height of the ocean. But these data provided only a limited picture.
In the study, the researchers added InSAR, or interferometric synthetic aperture radar, which allowed them to see where the ground was changing. InSAR is a technique that involves comparing satellite radar images of the same area collected at different times to spot movement on Earth’s surface and track changes in ground height.
The study found that Tutuila sank an average of 0.24 to 0.35 inches (6 to 9 millimeters) per year between 2015 and 2022 compared to 0.04 to 0.08 inches (1 to 2 millimeters) per year before a 2009 earthquake. The highest rates of sinking occurred right after the earthquake, especially along the coastlines.
Click here for more information.
Image Credit: NASA Earth Observatory/Lauren Dauphin
