Asian Surveying & Mapping
Breaking News
China sets historic Mars mission for 2028 as US plan remains in limbo
China is on track to launch its Tianwen-3 mission...
GNSS: Here’s how India’s new GPS-based toll system will change your highway travel
The Ministry of Road Transport and Highways has revised...
Shanghai Is Hit by Strongest Typhoon in Decades and Comes to a Standstill
Typhoon Bebinca, the strongest storm to hit Shanghai since...
Iran launches research satellite into orbit
TEHRAN: Iran on Saturday blasted a new research satellite...
Astha IT expands into Saudi Arabia with GeoTech
Astha IT, a US-headquartered leader in digital transformation and...
Nasa to launch project by Dubai student into space
A Dubai student's science experiment is being launched into...
China’s secretive space plane has returned to Earth. Its mission? Unknown
A Chinese “reusable experimental spacecraft” believed to be the...
China launches new set of classified Yaogan-43 satellites
HELSINKI — China launched a second group of classified...
China-Africa space cooperation benefits people across continent
The Egyptian satellite MISRSAT-2, a high-resolution optical remote-sensing satellite,...
Abu Dhabi astronomers discover new asteroid
ABU DHABI: The International Astronomical Centre in Abu Dhabi...

After an extremely wet October, southeast Australia continued to see heavy rainfall in November 2022. With soils already saturated and dams full, the latest storms have added to ongoing flooding across New South Wales and Victoria.

In the week leading up to Nov. 14, 2022, large parts of New South Wales and Victoria saw more than 50 millimeters of rain (2 inches). The town of Forbes, New South Wales, had the highest daily total for the week. It saw 118 millimeters (4.6 inches) fall in a 24-hour period spanning November 13-14. The abundant rain across the region caused rivers to rise and flood nearby towns. Forbes saw its third major flood event in just four weeks as waters on the Lachlan River rose faster than expected.

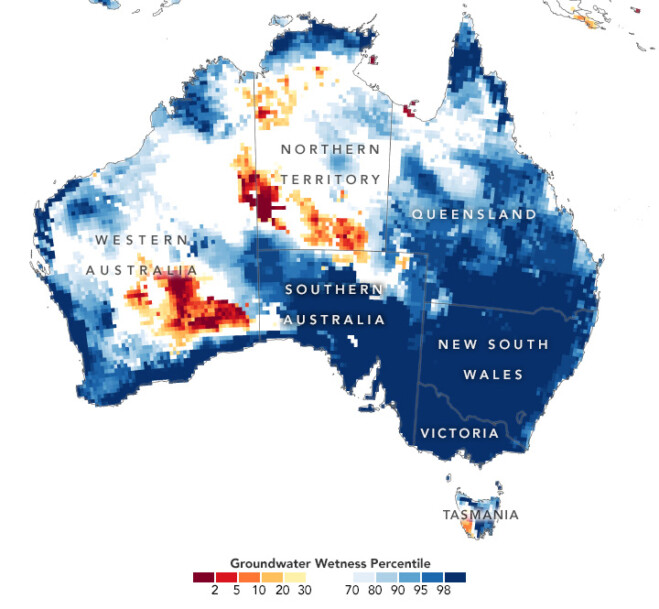
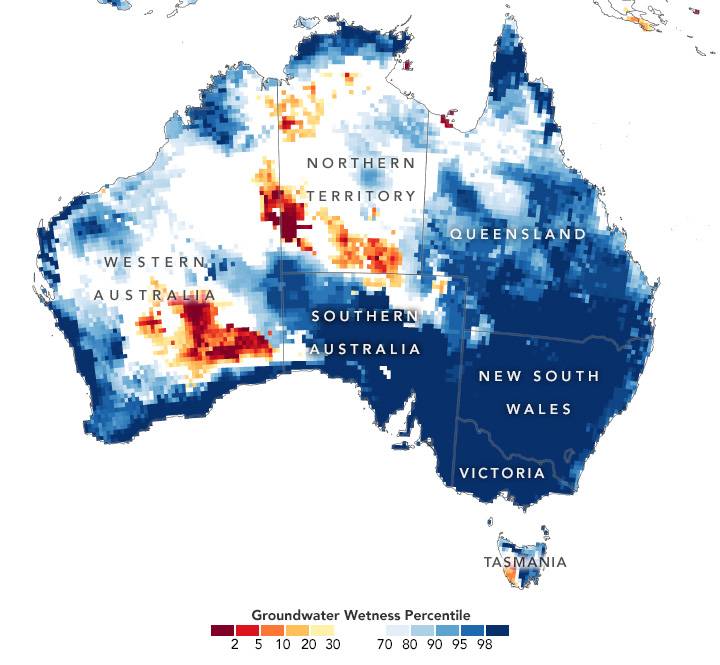
Water that seeps deep into the soil can influence groundwater levels for months. The accompanying map depicts shallow groundwater storage in Australia from Nov. 11-14, 2022, as measured by the Gravity Recovery and Climate Experiment Follow-On (GRACE-FO) satellites. The colors depict the wetness percentile; that is, how the levels of groundwater compare to long-term records (1948-2012). Blue areas have more abundant water than usual, and orange and red areas have less.