Asian Surveying & Mapping
Breaking News
Ecolab and ITE partners to harness water management knowledge for Singapore data center engineers
SINGAPORE, 29 APRIL 2024 – Nalco Water, an Ecolab...
NASA releases satellite photos of Dubai and Abu Dhabi before and after record flooding
NASA released photos of parts of Dubai and Abu...
Singapore releases 10-year Geospatial Master Plan
Singapore has launched its new Geospatial Master Plan (2024–33),...
Japan announces plans to launch upgraded observation satellites on new flagship rocket’s 3rd flight
TOKYO (AP) — Japan’s space agency announced Friday a...
Tesla China partners with Baidu for maps to clear FSD hurdle
Amidst Elon Musk’s unannounced trip to Beijing, China this...
ESA opens ideas factory to boost space innovation in Austria
A centre to innovate the design and manufacture of...
Japan’s space agency sets June 30 as third launch date for H3 rocket
The Japan Aerospace Exploration Agency (JAXA) announced Friday that...
S. Korea launches nanosatellite for Earth observation
SEOUL- A South Korean nanosatellite was launched into orbit...
Australian Space Agency funds development of aerospace-grade GNSS receiver
The Australian Space Agency has funded the development of...
Continuity risks for Australian EO data access
A new report details the widespread use of Earth...

India has the highest net cropland area while South Asia and Europe are considered agricultural capitals of the world


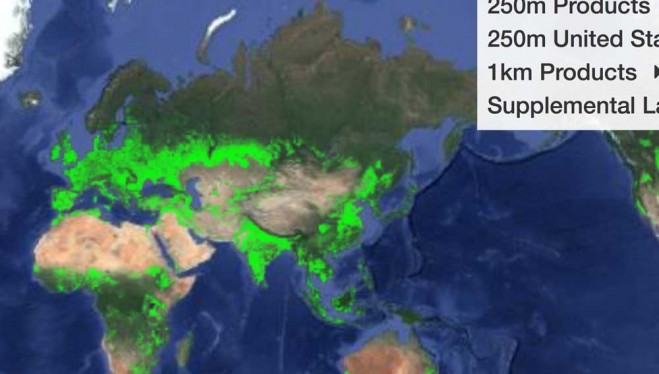
A new map was released detailing croplands worldwide in the highest resolution yet, helping to ensure global food and water security in a sustainable way.

The map establishes that there are 1.87 billion hectares of croplands in the world, which is 15 to 20 percent—or 250 to 350 million hectares (Mha)—higher than former assessments. The change is due to more detailed understanding of large areas that were never mapped before or were inaccurately mapped as non-croplands.

Earlier studies showed either China or the United States as having the highest net cropland area, but this study shows that India ranks first, with 179.8 Mha (9.6 percent of the global net cropland area). Second is the United States with 167.8 Mha (8.9 percent), China with 165.2 Mha (8.8 percent) and Russia with 155.8 Mha (8.3 percent). Statistics of every country in the world can be viewed in an interactive map.

The study was led by USGS and is part of the Global Food Security-Support Analysis Data @ 30-m (GFSAD30) Project. The map is built primarily from Landsat satellite imagery with 30-meter resolution, which is the highest spatial resolution of any global agricultural dataset.