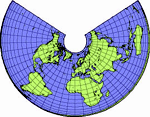

In a perfectly (flat) world, GIS buffering would assume a distance from a central point and draw a circle around that point of equal distance until it closes. It would look like a pie. The results would be accurate and one could roll up the paper and take it anywhere in the world, roll it out, and show it to clapping fans.
The problem is – the world is not flat. Datums matter. The concept of drawing that same circle on the world as we know it today gives rise to conflicts in positional accuracy and precision. This happens due to the fact that the world is not just unround, but it is very elongated elliptical shaped. In fact, recently released gravity data for the world and a new model describe the world more like an apple. That’s another story – let’s get back to the datums.
What really prompted this entry is the excellent article by Drew Flater and the Esri Geoprocessing Development Team (noted below). That team showed that if one uses a GIS software to buffer over wide areas, then datums ultimately play a more important role. Suddenly that nice circular buffer bends, twists and takes on a different shape, extending to conform with the existing datum (see the article pictures).
My guess is that many of us forget these quirks as they happen at times, reminded only when we see them in maps and other cartographic products that depend upon physical properties of the earth. In the case of the recent Japan Earthquake event it has particular significance.
As the buffer or so called radiation impacted area increases in size and is displayed using a map, then the significance of the datum begins to play a greater role. Depending on the size of the buffer, it may take on different meaning. Once we start talking about a few thousand kilometers or so in terms of radiative effects, then questions relating to distances begin to change as displayed in buffered computations.
It has been reported that the Japan land base was moved up to 25 meters in places due to the earthquake. In other places the land has shifted downward, causing the recent flooding we have witnessed, as heights decreased. It is important to understand that mapping and geospatial technologies consider the physical shape of the earth when operating. Accordingly, as seismic activity and other events occur, our solutions can be impacted.
References
Canadian Spatial Reference System (CSRS) High Precision Datum
Mean Sea Level, GPS, and the Geoid
Understanding Geodesic Buffering
