GOLDEN, Colorado – Golden Software, a developer of affordable software for visualizing and analyzing diverse data sets, has released the newest version of its scientific graphing package, Grapher™. New capabilities significantly improve the user’s ability to model, analyze and interpret multiple data sets together.
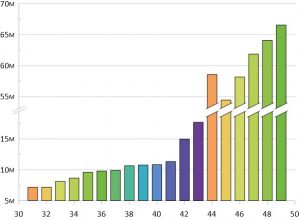
Grapher users can customize how break axes display for bar charts. Add a grid line, empty space, the axis break symbol, or a user defined symbol to show where the break affects the plot.
Grapher is used extensively by scientists and engineers in oil & gas operations, environmental consulting, climate research, mineral exploration, and academic pursuits. The package offers deeper insights into diverse data sets, including chemical, physical, geologic and geospatial data, through 80 different 2D and 3D plotting types.
“The enhancements and additions in the latest version of Grapher are designed to make it easier for users to tackle bigger scientific graphic projects – involving more data,” said Leslie McWhirter, Grapher’s Technical Product Manager. “New functionality enables users to create visually dynamic graphs that communicate results clearly and concisely.”
The newest release of Grapher, which is downloadable this week to all users with active maintenance agreements, includes these enhancements:
Broken Axis Bar Charts – When displaying data with bar charts in which one or more bars has a significantly higher value than others, break the axis and the bars with a symbol or grid line to draw attention to the full range of data values.
New Colormap Editor – Customize colormap gradients to adjust the colors and opacity, making it easier to emphasize a zone of significance in a plot.
Color Gradients across Multiple Line Plots – Apply a colormap gradient across multiple line plots in a graph in order to quickly and easily differentiate them from one another.
Grid Lines across Multiple Axes – To make correlations between plots easier to see, extend grid lines across two or more plots sharing common X or Y axes.
New Legends and Color Scales – Add color scales to scatter plots colored with a colormap gradient, and legends to plots containing color tables or symbol tables, making for easier-to-understand graphics.
Add Plot Titles –Label plots with the plot name in order to convey what the plot represents without having to add a legend.
Print or Export Multiple Pages – From multi-page project files, print or export one, many, or all of those pages using a single time-saving operation.
Enhanced File Share Functionality – Grapher Preview users can now save files that can automatically be opened into the latest Grapher release without having to save back to an older file format. Additionally, files created in any future version of Grapher or Grapher Preview can be opened in any version back to this version of Grapher.
Golden Software’s development team is already working on new features, functionality and enhancements for the next version of Grapher that will be released later this year. Users with active maintenance can take these new capabilities for a test drive by downloading the Grapher Preview. They are invited to send comments and/or questions directly to the Golden Software development team as they use the Preview version in their day-to-day workflows.
“In this version of Grapher Preview, we are focused on making it easier for users to customize their graphs,” said McWhirter.
Specifically, newest Grapher Preview features include:
Details on Grapher Preview may be accessed here: What is Grapher Preview?.
About Golden Software
Founded in 1983, Golden Software is a leading developer of affordable scientific graphics software. Its customer base includes over 100,000 users involved in environmental consulting, oil and gas exploration and extraction, mining exploration and extraction, engineering, applied science, business, education, and government in 186 countries and territories. Golden Software offers six products: Surfer® for gridding, contouring and 3D surface mapping; Voxler® for 3D data visualization; Grapher™ for 2D and 3D graphing; Strater® for well log, borehole and cross section plotting; MapViewer™ for thematic mapping and spatial analysis; and Didger® for digitizing and coordinate conversion.
For additional information, visit www.GoldenSoftware.com or call 1-303-279-1021.
