Asian Surveying & Mapping
Breaking News
South Korea is converting an abandoned coal mine into a moon exploration testing ground
South Korea is transforming abandoned coal mines into testing...
ISRO to Launch Chandrayaan-5 With Japan, Plans Space Station
Dr. V. Narayanan, Chairman of the Indian Space Research...
Russia and China are threatening SpaceX’s Starlink satellite constellation, new report finds
SpaceX's Starlink satellite constellation is facing threats from Russia...
China and Pakistan agree to fly 1st foreign astronaut to Chinese space station
For the first time, the Chinese space program will train...
ISRO’s “Space on Wheels” offers a peek into Indian Space Programme to students in Karimnagar
The Indian Space Research Organisation (ISRO)’s “Space on Wheels”...
Geospatial led solutions build the foundations for better decision-making
Geo Connect Asia 2025 paves the way for turning...
GEOSA, Singapore Land Authority Launch Achievements of Joint Geospatial System Project
Riyadh, SPA -- The General Authority for Survey and...
Building in Bangkok collapses as powerful earthquake hits southeast Asia
One person has died and 50 were injured in...
Bellatrix Aerospace Partners with Astroscale Japan for Space Debris Removal
Bellatrix Aerospace, a Bengaluru-based space mobility company, has joined...
NSTC announces Pingtung site as Taiwan’s space mission launch center
Taipei, March 26 (CNA) Taiwan's National Science and Technology...

June 23rd, 2017
New Interactive Maps for Entire United States

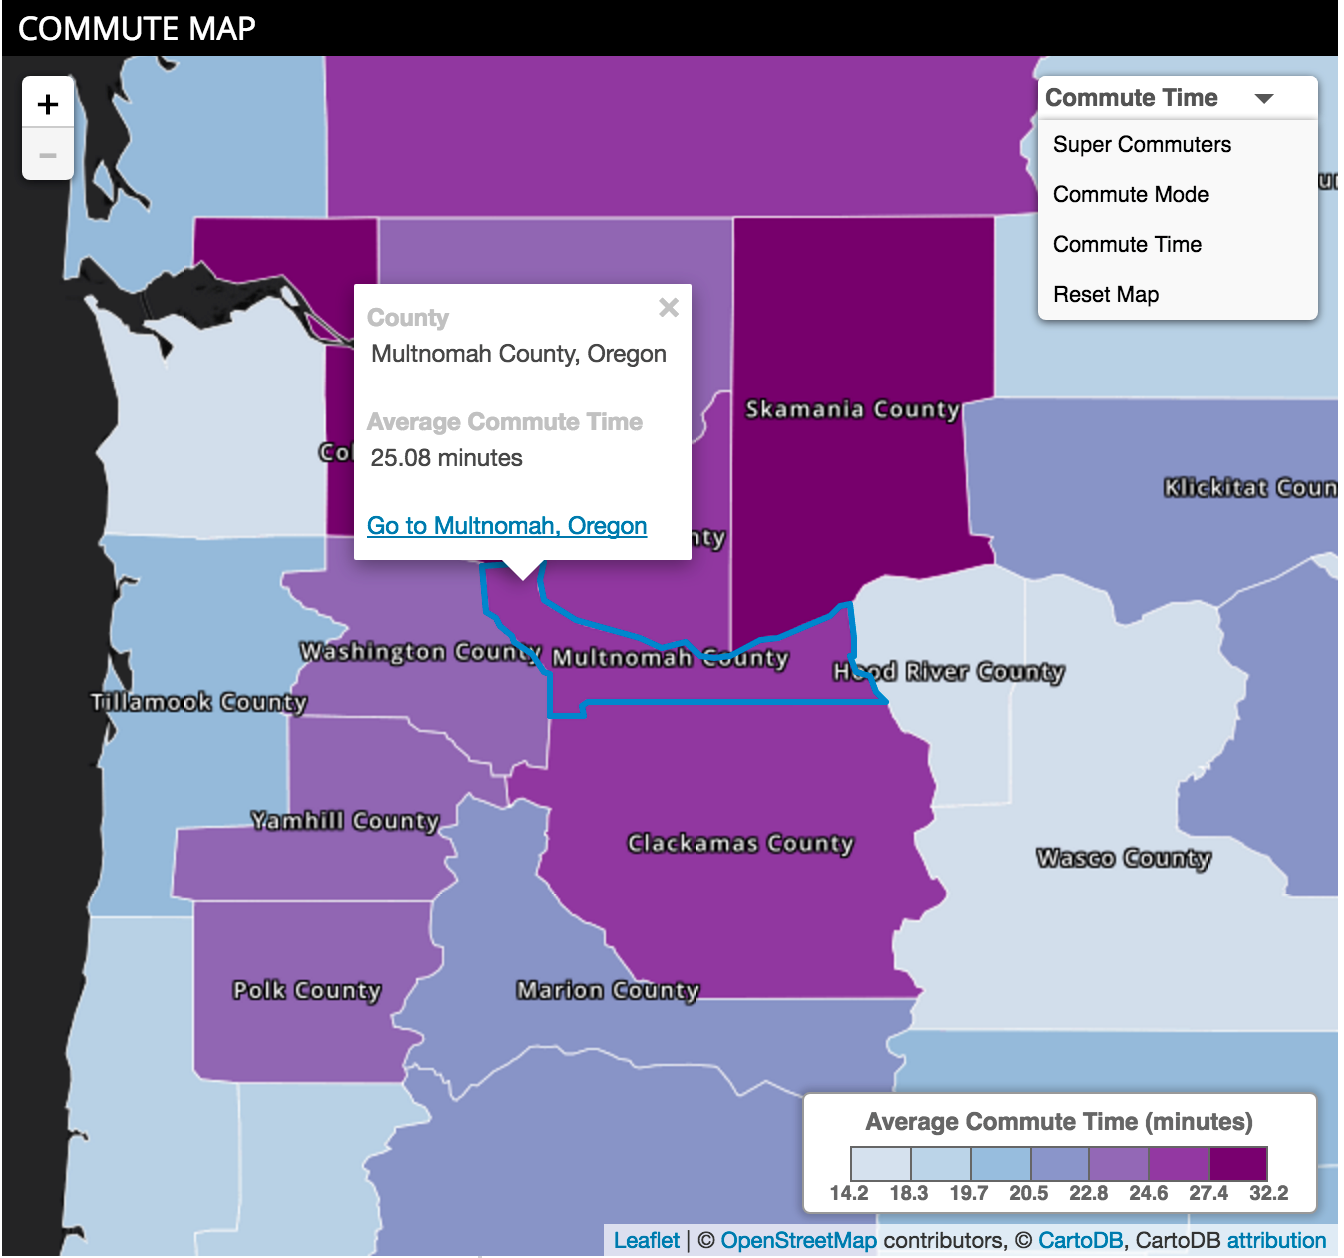
Sperling’s BestPlaces has released a series of interactive choropleth maps on a dozen categories of information for each State, County, City, and Zip Code. From Cost of Living information to Commute Times, the interactive maps enable people to explore and learn about places all over the United States.
rer.png

Choropleth representation is a thematic mapping technique where geographic areas are filled with colors that are in proportion to some underlying data about each area with the purpose of displaying a geographic pattern. The maps are easy to read and use, and display a lot of information.

You can explore 42 different datasets over 12 categories of information via the dropdown menu. You can pan around, zoom in and out, and reset the map to its original condition. If you want to change the data category, navigate to that category by using the left-hand navigation on the webpage. What’s more, you can click each place on our interactive maps to find out exact values. And, if you want to explore that particular place, follow the link to each places’ webpage.

Each map has been crafted to optimize performance and accessibility for everyone; they’re even smartphone friendly.  Go to bestplaces.net, create a username and log in to view our maps.

About Sperling’s BestPlaces –  Serving 2 million visitors a month, Sperling’s BestPlaces website www.bestplaces.net puts insights and facts in the hands of the public so they can make better decisions about best places to live, work, retire, play, or relocate.