GOLDEN, Colorado, 12 March 2024 – Golden Software, a leading developer of scientific graphing and visualization software, has added Grouped Box Plot functionality to make sensor data easier to import and plot in the latest version of its Grapher scientific graphing package. In addition, new Beta capabilities being tested in the release make the software more user friendly and easier to learn.
No more wrestling with pivot tables or manual data layout adjustments. Use your data as is to clearly visualize all data in one easy to create graph.
“The major enhancement in Grapher is the addition of a new Grouped Box Plots function which will appeal to users in every sector,” said Santiago Vivas, Grapher Product Manager. “Users will spend less time reorganizing the data sets from sensors and preparing them for import into Grapher.”
Grapher is used extensively by scientists and engineers in environmental services and consulting, climate research, exploration, and academic pursuits. The package offers deeper insights into diverse data sets, including chemical, physical, geologic, and geospatial data, through 80 different 2D and 3D plotting types. Grapher is often used to plot data captured by a variety of chemical and physical sensors in the field.
The newest release of Grapher, which is downloadable now to all users with active maintenance or subscription agreements, includes these enhancements to the Grouped Box Plot capabilities.
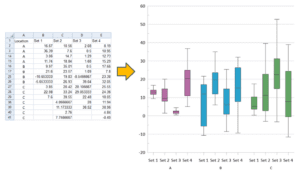
The new Grouped Box Plots function caters to the data structure that is common for data sets exported from many field sensors. In the past, Grapher users had to reorganize their sensor data into the right structure using spreadsheets for the software to accept them and create box plots. This once time-consuming and painstaking process is now eliminated by the new Grouped Box Plots function which directly accepts the sensor data sets in their native structure. Grapher now recognizes categorized data and automatically splits data values into various categories. Users can select in advance how the software will colorize the data values based on categories or variable types.
Grapher users can now also change the scale of the axes for Grouped Box Plots, allowing these graph types to be combined with any others. Previously, the axis scale was fixed, but now users can add other variables, such as time. This greatly enhances the ability of users to analyze time data series and other changes of values over time with Grapher.
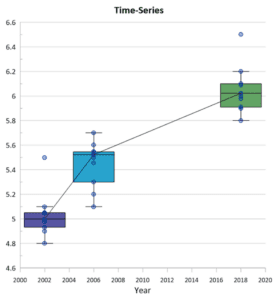
Grouped box plot axes also allow you to plot combine your box plots with other plot types to make your data’s story even more compelling.
Grapher Beta Available
As is the tradition, Golden Software has released a Beta version of Grapher simultaneously with the new version to give customers a chance to try out new features and provide feedback while they are still in development. Users may find the Beta version by clicking File | Online from within Grapher.
“The Beta features in this Grapher release result from a usability study we performed last year to determine how we could make the package more intuitive and user friendly for both long-time and first-time customers,” said Vivas. “The command menus and ribbons have been greatly simplified to be more obvious and discoverable.”
Key Beta functions in this version include:
“Overall, Grapher users will find the file menus and command ribbons are now similar to, and consistent with, interface elements in Golden Software’s popular Surfer gridding, mapping and 3D visualization package,” said Vivas. “For our many customers who use both packages, we are making the transition between them as seamless as possible.”
About Golden Software
Founded in 1983, Golden Software is a leading developer of scientific visualization software at a great value. Its customer base includes over 100,000 professionals involved in environmental services, engineering consulting, resource exploration and extraction, applied science, business, education, and government in nearly 190 countries and territories. Golden Software offers two products: Surfer® for gridding, mapping & 3D visualization system and Grapher™ for 2D and 3D graphing. Golden Software offers its clients personalized support invested in their success.
For additional information, visit www.GoldenSoftware.com or call 1-303-279-1021.
