Asian Surveying & Mapping
Breaking News
Iraq’s First Fully Solar-Powered Village in Kulak Is Now Operational
ERBIL, Kurdistan Region – May 20, 2025 — The...
Australia’s Gilmour Space Technologies ready to launch maiden Eris Test flight the nation’s first orbital launch in over 50 years
Gilmour Space Technologies is the leading launch services company...
Korea’s space agency seeks revision of plan to modify next-gen rockets into reusable system
South Korea's aerospace agency said on Thursday that it...
UAE Space Agency Signs Agreement With Technology Innovation Institute to Execute the Emirates Mission to the Asteroid Belt’s Lander Project
In the presence of His Highness Sheikh Hamdan bin...
Private Japanese lunar lander enters orbit around moon ahead of a June touchdown
A private lunar lander from Japan is now circling the moon, with...
Indian astronaut to travel soon to ISS as part of ISRO-NASA Mission
Prime Minister Narendra Modi said by 2040, an Indian’s...
China issues regulatory framework to support direct-to-device satellite services
HELSINKI — China has released comprehensive regulations for direct-to-device...
Astranis clinches $115 million Taiwan deal despite satellite setback
TAMPA, Fla. — Astranis has signed a $115 million...
UAE and Egypt Strengthen Space Collaboration with New MoU
In a milestone development for Arab space collaboration, the...
Seoul launches 4th spy satellite to boost North Korea surveillance
South Korea’s military now operates an increasingly integrated cluster...

March 15th, 2023
Golden Software Makes Grapher Package Faster to Learn, Easier to Use

Visualizing Data, Communicating Results Remain Focus

GOLDEN, Colorado – Golden Software, a developer of affordable software for visualizing and analyzing diverse data sets, has focused on improving the user friendliness of its Grapher scientific graphing package for both existing and first-time users. Available today, the new version of Grapher includes enhancements that make it easier to use and faster to learn.

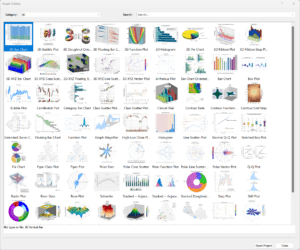
Visually search, sort and filter through compact views of sample plots to discover Grapher’s possibilities.

“Our goal with the latest iteration of Grapher is to improve the overall user experience through redesigned functions and a more intuitive interface,” said Santiago Vivas, Grapher Product Manager. “First-time users will experience the full value of visualizing and communicating their data with Grapher much earlier in the learning process.”

Grapher is used extensively by scientists and engineers in environmental services and consulting, climate research, exploration, and academic pursuits. The package offers deeper insights into diverse data sets, including chemical, physical, geologic, and geospatial data, through 80 different 2D and 3D plotting types.

“Grapher enables users to make better decisions by visualizing complex data sets in ways that simply can’t be accomplished with spreadsheets,” said Vivas. “Just as importantly, users can then leverage Grapher to visually communicate their project results with others.”

The newest release of Grapher, which is downloadable now to all users with active maintenance or subscription agreements, includes these enhancements:

Worksheet Remapping

  • Users often work with different versions of data that are in the same format. For example, streamflow data over different time periods. The new “Remap Worksheets” command allows users to select the new or updated data source. When the new file is linked, all associated graph objects (plots, axis, text, etc.) are automatically updated using the new data. This makes it easier to keep a periodic monitoring project updated with new data every week, month, quarter, etc.


Graph Gallery

  • The new Graph Gallery allows users to search, sort, and filter through compact views of sample plots without needing to open the project files, providing users with a new way to get started and discover Grapher’s possibilities.


Performance Upgrades

  • Large datasets can be drawn much faster with the Thinned Plot option. This new feature allows users to selectively reduce or “thin” out data that is displayed in the plot views, improving drawing performance and overall visual clarity.
  • The Auto Redraw feature pauses the redrawing of the plot when zooming and scrolling. This is particularly helpful when adjusting plots with large data sets.


Print Preview

  • Users creating large documents for printing can now see how the printed layout will look on paper before hitting the “Print” button, dramatically speeding up the production of reports.


New Graph Categories

  • Grapher’s 80 graph types are easier to locate in the user interface thanks to a more intuitive renaming of the six graph categories.


“Moving forward with Grapher development, our primary objective is to continue making it simpler for users to analyze diverse data sets and communicate their results in ways that are easy to understand,” said Vivas.

About Golden Software

Founded in 1983, Golden Software is a leading developer of affordable scientific graphics software. Its customer base includes over 100,000 users involved in environmental services, engineering consulting, oil and gas exploration and extraction, mining exploration and extraction, applied science, business, education, and government in nearly 190 countries and territories. Golden Software offers two products: Surfer® for gridding, contouring and 3D surface mapping and Grapher™ for 2D and 3D graphing.

For additional information, visit www.GoldenSoftware.com or call 1-303-279-1021.