GOLDEN, Colorado – Golden Software’s Surfer package, long known as the geoscience profession’s most powerful 3D surface mapping software, now provides robust subsurface visualization and modeling functionality. In the latest Surfer release – available today – Golden Software has incorporated many true 3D gridding and visualization tools.
The new functionality literally adds a new dimension to Surfer’s gridding, mapping, and visualization capabilities. Users can now model a fourth “C” variable, such as contaminant or chemical concentration, along with the traditional X, Y, Z values.
Interpolate and visualize 3D data, such as subsurface soil or groundwater contamination, mineralization concentration, seismic refraction velocity, temperature distribution, or dissolved oxygen concentration.
“Surfer users can visualize their 3D data sets more accurately and extract richer information from them,” said Kari Dickenson, Surfer Product Manager. “This is extremely useful for geologists, geophysicists, hydrologists, and environmental engineers to visualize subsurface conditions around drillholes and in water tables, contamination plumes and hydrocarbon reservoirs.”
Equipped with fast and powerful contouring algorithms, Surfer has been relied upon for the past 40 years to easily visualize, analyze, and interpret complex data sets. It is used by more than 100,000 professionals worldwide, many involved in environmental services, engineering consulting, oil & gas exploration, mining, and geospatial projects.
The new version of Surfer includes several enhancements:
True 3D Grids – Users can create 3D grids from data with X, Y, Z and the additional “C” variable, such as groundwater or soil contaminant concentration. This makes it possible to visualize how the concentration or other variable changes over an area with depth or elevation.
2D Map Creation from 3D Grid – Users can create a 2D map of a slice through a 3D grid and move the slice up and down through the 3D grid, dramatically illustrating how the C value changes with depth.
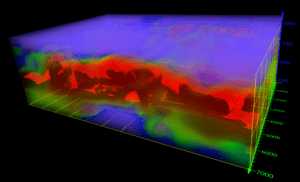
3D Rendered Volume – Visualize the 3D grid in the 3D View as a solid body by assigning colors to different C values to highlight variations in the data. Colors can be fully or partially transparent so that other surfaces or details remain visible.
Isosurface Creation – Visualize the 3D grid in the 3D View as an isosurface – a surface of constant value in a three-dimensional volume – providing another way to visualize how C data varies with depth or elevation. Calculate the volume on either side of the isosurface value.
Surfer Beta Available
As is the tradition, Golden Software has released a Beta version of Surfer simultaneously with the new version to give customers a chance to try out new features while they are still in development. Users may find the Beta version by clicking File | Online from within Surfer.
“The Beta capabilities under development significantly build on the true 3D gridding functionality released today,” said Dickenson. “Not only are we adding XYZC tools, we are making them easier to access and use.”
Here are the new features available in Beta now, to be officially included in the next Surfer release:
About Golden Software
Founded in 1983, Golden Software is a leading developer of affordable scientific graphics software. Its customer base includes over 100,000 professionals involved in environmental services, engineering consulting, oil and gas exploration and extraction, mining exploration and extraction, applied science, business, education, and government in nearly 190 countries and territories. Golden Software offers two products: Surfer® for gridding, contouring and 3D surface mapping and Grapher™ for 2D and 3D graphing.
For additional information, visit www.GoldenSoftware.com or call 1-303-279-1021.
