
GOLDEN, Colorado – Golden Software, a developer of affordable software for data visualization and analysis, has released Version 15 of its Grapher scientific graphing package with new capabilities to improve a user’s ability to model, analyze and interpret data – and communicate the results.
“Grapher users can now access new Fit Curve, Axes and Statistical Plotting capabilities, along with greater color customization functions, in the latest release,” said Leslie McWhirter, Grapher Product Manager. “These enhancements give Grapher users a more powerful ability to display and communicate the results of their work to others.”
Used extensively by scientists and engineers in oil & gas operations, environmental consulting, mineral exploration, and academic research, Grapher gives users deeper insights into their data. The software provides 80 different 2D and 3D plot types for analyzing and displaying scientific data.
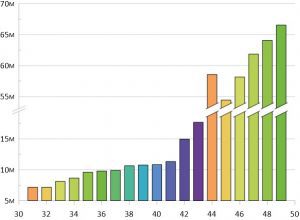
Grapher users can now break bar chart bars at the axis break location with a symbol or grid line to draw attention to the full range of data.
Grapher 15 includes these enhancements:
Fit Curve Improvements – Users can now add X=F(Y) fit curves to model borehole log data. Fit curves can also be added to class plots to model all or individual classes.
Axes Upgrades – Break Axes are improved so users can customize the break mark and add a break distinguisher to the plot itself. Ternary plots have also been enhanced to enable users to rotate the axis direction.
Statistical Enhancements – Grapher users have greater control over how values in Box-Whisker plots are graphed. In addition, there are new mathematical options to expand on the functionality of the summation plot.
Enhanced Color Functions – Improvements to colors include the ability to vary color fills above and below the intersection of two plots, specify custom colors via RGB values to color scatter plot symbols, and assign colors from a gradient to scatter plot symbols based on numeric worksheet values
Formally released last week, Grapher 15 is downloadable by all users with active maintenance agreements.
The Preview version of Grapher 16 has also been released, allowing customers to try new functions relatively early in the development process and provide feedback before the final version is released. Grapher users with active maintenance can download the Preview, access new and updated features, and send comments and/or questions directly to the Golden Software development team.
“In Grapher 16 Preview, we are continuing to focus on improving the quality and customization of graphing outputs so our customers can better communicate results with stakeholders,” said McWhirter. “We are also making it easier to share Grapher files among present and future versions of the software.”
Specifically, upgrades in Grapher 16 Preview include the following:
Broken Axis Bar Charts – When displaying data with bar charts in which one bar has a significantly higher value than others, Grapher users can break the bar with a symbol or grid line to draw attention to the full range of data values.
New Colormap Editor – Grapher leverages a feature from Golden Software’s Surfer package, maintaining similarity across software products. Users can customize color selections and modify color gradients to give them more or less opacity, thus making a selected color stand out for the purpose of highlighting a certain result in a plot.
Legends and Color Scales – Users may now add color scales and legends to Grapher outputs, making the results more easily understandable.
Enhanced File Share Functionality – Starting with Grapher 16, users will be able to open any Grapher files created with newer versions of the software package released in the future.
Details on Grapher Preview may be accessed here: What is Grapher Preview.
About Golden Software
Founded in 1983, Golden Software is a leading developer of affordable scientific graphics software. Its customer base includes over 100,000 users involved in environmental consulting, oil and gas exploration and extraction, mining exploration and extraction, engineering, applied science, business, education, and government in 186 countries and territories. Golden Software offers six products: Surfer® for gridding, contouring and 3D surface mapping; Voxler® for 3D data visualization; Grapher™ for 2D and 3D graphing; Strater® for well log, borehole and cross section plotting; MapViewer™ for thematic mapping and spatial analysis; and Didger® for digitizing and coordinate conversion.
For additional information, visit www.GoldenSoftware.com or call 1-303-279-1021.
